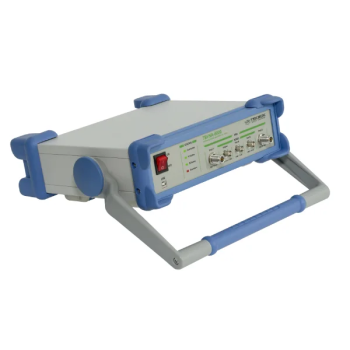
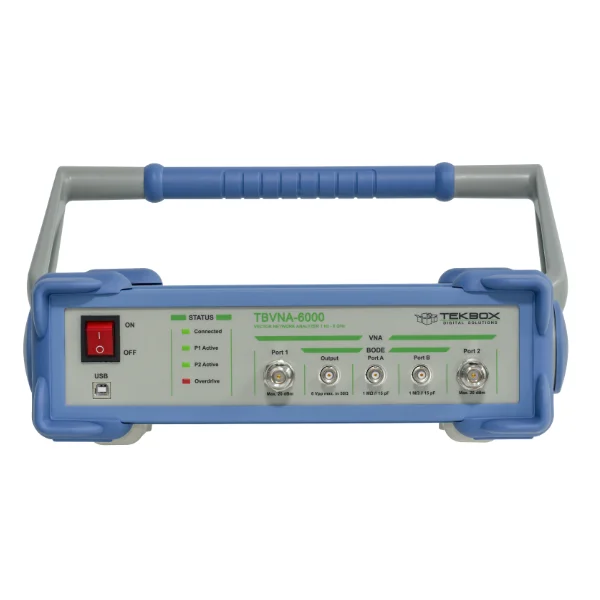
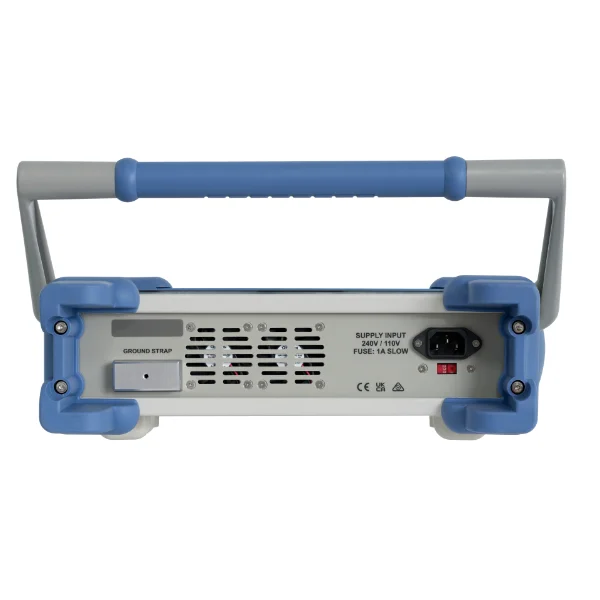
TBVNA-6000 0.1 Hz – 6 GHz Vector Network Analyzer
0.1 Hz – 6 GHz Vector Network Analyzer
Two-port vector network analyzer covering very low frequencies through 6 GHz for component and network characterization.
- 0.1 Hz – 6 GHz Vector Network Analyzer
- 0.001 Hz – 500 MHz Bode Analyzer (requires Bode Hardware Option)
- Signal generator 0.1 Hz – 6 GHz with 0.1 Hz resolution
- Four-channel 60 MHz digital oscilloscope with 125 MS/s and 14-bit resolution. (Two 50 ohm inputs, two 1 megohm inputs)
- Two-Channel DC – 6 GHz spectrum analyzer, with an unambiguous frequency range of DC – 60 MHz and an active sideband suppression for spurious-free signal measurements up to 6 GHz (under certain conditions) and a cross-correlation option. (Input channels can be among all 4 input ports)
MARKETS:
- Automotive ,
- Avionics ,
- Components ,
- Industrial ,
- Information Technology ,
- Medical Electronics ,
- Military ,
- Power Generation ,
- RF ,
- Space ,
- Wireless/Telecom ,
CATEGORIES:
TEST STANDARDS:

TBVNA-6000 Documentation
TBVNA-6000 Operation Manual
SPECIFICATIONS
TBVNA-6000 0.1 Hz to 6 GHz Vector Network Analyzer
The TBVNA-6000 measures how a device reflects and transmits a signal in both directions. Its two DC-coupled RF ports and four parallel receivers cover very low-frequency networks as well as RF components. Add the Bode hardware to measure gain and phase in power supply control loops and other circuits that benefit from high-impedance probing.

What you can measure
- Filters, attenuators and interconnects. Use S21 and S12 to see insertion loss, isolation and transmission phase. Use group delay to see how delay changes across the passband.
- Antennas and impedance matching. Use S11 or S22 to evaluate return loss and VSWR. A Smith chart shows how impedance changes with frequency so you can assess matching adjustments.
- Power supply loop stability. With the Bode option and an appropriate injection transformer, measure loop gain and phase and assess gain and phase margin.
- RF troubleshooting. Use power sweeps to see how response changes with drive level. Spectrum, time-domain and noise utilities help investigate harmonics, waveforms and suspected noise sources.
VNA measurements, software and data export
TekBox specifies more than 50 trace functions. Build a workspace with several diagrams and traces, then save the setup for repeat measurements. For example, display S11 on a Smith chart while tracking S21 insertion loss, phase and group delay on separate plots.
| Feature | What it does |
|---|---|
| Reflection and impedance | Use S11 and S22 to evaluate input and output match. Display return loss, VSWR, or complex impedance to see where a network departs from its target impedance. |
| Forward and reverse transmission | Use S21 and S12 to compare gain, insertion loss, reverse isolation and phase. Group delay helps identify frequency regions where a filter introduces extra delay. |
| Amplifier analysis | Derived functions cover forward and reverse voltage and current gain, stability factor, maximum stable gain and maximum available gain. The manual also describes gain calculations for specified loads, including transducer gain. |
| Lumped components and resonators | Use the component measurement functions to investigate impedance and the behavior of resistors, capacitors and inductors over frequency. The manual describes loaded Q measurement for resonant networks. |
| Time-domain transforms | Low-pass and band-pass processing turn swept frequency data into time-domain views. Use those views to investigate cable faults, locate impedance discontinuities or separate responses during filter tuning. |
| Plots and markers | Use rectangular, polar and Smith displays, linear or logarithmic axes, and multiple traces on one diagram. Delta markers measure differences between points. Horizontal and vertical markers make reference levels or frequencies easy to see. |
| Trace math and limits | Apply normalization, magnitude, phase, logarithmic, real, imaginary, complex and delay operations. Use the equation editor for custom results and display trace limits when comparing a measurement with design targets. |
| Reference traces and export | Store up to four full S-parameter sets in memory for comparisons. Import or export Touchstone data, including measured two-port .s2p files. Save, print or copy diagrams and recall saved measurement setups and calibrations. |
| Guided calibration and fixture correction | Define calibration standards using kit parameters or supported Touchstone files. Shift the reference plane with port extension or remove the response of a characterized fixture using full two-port de-embedding. |
Measurement examples for EMC and RF development
- RF current probe characterization. Use a suitable calibration fixture to measure the probe response across frequency and derive transfer impedance from the calibrated measurement. TekBox provides a tutorial on the procedure.
- Antenna tuning. Sweep the operating band and inspect return loss, VSWR and the Smith trace. Use those views to identify resonances and guide changes to the matching network.
- Filter and cable verification. Compare measured transmission with a saved reference. Use time-domain reflection to investigate whether a cable, connector or fixture accounts for a discontinuity.
- Power converter and regulator stability. With the Bode hardware, select a suitable injection transformer, measure the loop response, and inspect gain margin, phase margin and crossover frequency. Nyquist plotting provides another view of loop stability.
Two-port VNA specifications
| Specification | Value |
|---|---|
| Frequency range | 0.1 Hz to 6 GHz |
| Measurements | S11, S21, S12 and S22 with four parallel receiver chains |
| Ports | Two DC-coupled 50 ohm N-female ports |
| Sweeps | Linear or logarithmic, 2 to 100,000 points, continuous, single or hold |
| Measurement bandwidth | 0.01 Hz to 400 kHz |
| Measurement speed | Typically 250 microseconds per point at 400 kHz bandwidth for a unidirectional measurement |
| Frequency accuracy | +/-25 ppm. TekBox lists a 0.001 Hz frequency step in the detailed VNA table and 0.1 Hz in its feature overview. |
| VNA source power | 1 Hz to 500 MHz: -50 to -6 dBm. 500 MHz to 4 GHz: -70 to -5 dBm. 4 to 6 GHz: -70 to -10 dBm. Settings in 0.25 dB steps. |
| Port return loss | Better than 20 dB through 1.5 GHz and better than 10 dB through 6 GHz |
| Calibration | Normalization and short-open-load-through (SOLT). Through, one-port or full two-port calibration, plus DC-offset calibration. |
| Fixture correction | Port extension with loss, delay and reference impedance adjustment, plus full de-embedding |
| Display and trace tools | Rectangular, polar and Smith charts, time-domain and group-delay displays, trace math and four full S-parameter memory slots |
Calibrate at the DUT reference plane. Choose a calibration kit that matches the connector and gender at the ends of your test cables. Port extension and de-embedding help account for known fixture effects.
Optional Bode analyzer and high-impedance inputs
| Specification | Value |
|---|---|
| Bode frequency range | 0.001 Hz to 500 MHz |
| Measurement bandwidth | 0.001 Hz to 400 kHz |
| Gain and phase | Absolute channel levels and channel ratios. Linear or logarithmic sweeps with 2 to 100,000 points. |
| Dedicated source | -17 to +24 dBm from 0.001 Hz to 200 MHz. -17 to +10 dBm from 200 to 500 MHz. Output adjustment in 0.1 dB steps. |
| Additional inputs | Two DC-coupled BNC inputs, 1 megohm in parallel with 15 pF each |
| Input ranges and bandwidth | +/-20 V and +/-5 V ranges through 500 MHz. +/-0.5 V range through 250 MHz. |
Segmented Bode sweeps. Set source power, measurement bandwidth and input attenuation by frequency segment. That lets you lower the drive where the circuit is sensitive and optimize the receiver settings where the response is small. Compare input ratios on magnitude and phase plots or use the equation editor to derive application-specific traces.
Order by configuration. TBVNA-6000 is the base VNA. TBVNA-6000-B is the VNA with Bode hardware, the dedicated source and the two high-impedance BNC inputs. Those inputs can also serve as a vector voltmeter for relative amplitude and phase measurements.
Spectrum, signal generation and time-domain utilities
| Specification | Value |
|---|---|
| Spectrum analysis | Two parallel channels with cross-correlation. 0.1 Hz to 6 GHz coverage with 0.1 Hz to 3 MHz resolution bandwidth. The unambiguous band extends to 60 MHz. Higher-frequency measurements use sideband suppression under the conditions described in the manual. |
| Spectrum amplitude and input | Typical amplitude accuracy +/-1.5 dB. Maximum linear input +20 dBm with the attenuator enabled. Observe the manual limits for each mode and attenuation setting. |
| CW signal generator | Coverage through 6 GHz. TekBox lists 0.1 Hz as the headline lower limit and 0.001 Hz in the datasheet utility table. See the datasheet for frequency-dependent source levels. |
| Digital oscilloscope | 60 MHz Nyquist bandwidth, up to 125 MS/s real sampling, 14-bit resolution and up to 8,192 points. The four-input setup uses two additional inputs supplied with the Bode hardware. |
| Other measurements | Wideband RF power and voltage, total harmonic distortion, phase noise and noise voltage spectral density. IQ streaming to file or over Ethernet supports GNU Radio workflows. |
Additional software utilities
| Feature | What it does |
|---|---|
| Spectrum and logarithmic spectrum views | Inspect signals and interference in the frequency domain. Display RMS, minimum, maximum or average traces and use dual-channel correlation when the measurement calls for it. Select available inputs according to the installed hardware. |
| Phase noise | Inspect noise around a carrier at selected offsets. At a 300 MHz carrier in low-noise mode, TekBox lists levels below -90 dBc at 100 Hz offset, below -115 dBc at 1, 10 and 100 kHz, and below -125 dBc at 1 MHz. |
| Noise voltage spectral density | Investigate low-level noise by frequency. The datasheet specifies input noise voltage below 30 nV/sqrt(Hz) above 10 kHz. |
| CW stimulus | Drive a DUT with a fixed-frequency tone. The detailed utility table lists -50 to -6 dBm through 500 MHz and output settings from -5 dBm to below -80 dBm above 500 MHz through 6 GHz. Check the datasheet for amplitude accuracy at the chosen level. |
| Digital oscilloscope and protocol analysis | Use edge or pulse triggering, adjustable trigger delay, and measurements such as RMS and period. TekBox lists SPI, I2C and RS-232 protocol analysis, an adjustable CIC filter, and up to 16-bit resolution with that filter. Real-time sampling runs from 15 S/s to 125 MS/s. The datasheet also lists a separate sinc interpolation range of 250 MS/s to 4 GS/s. |
| Wideband RF power and voltage | Use the RF millivoltmeter and power measurement tools to check levels before or during a test. |
| Total harmonic distortion | Measure harmonics relative to the fundamental to investigate distortion in an amplifier or other circuit. |
| Power sweep | Sweep stimulus level and plot output power against input power to investigate gain compression or other level-dependent behavior. |
| Demodulation and IQ capture | Demodulate AM, FM or SSB to the PC audio system. Use IQ streaming to file or Ethernet for analysis workflows such as GNU Radio. |
| Programming and repeatable setups | Use TekBox’s programming manual for external control. Saved setups, calibration files and Touchstone export help reproduce and document a measurement. |
Bench setup and included items
| Specification | Value |
|---|---|
| Computer interface | USB 2.0 to a Windows PC. TekBox specifies an AVX2-capable CPU in the setup guide. |
| AC input | 100 to 120 V AC or 200 to 240 V AC, 50 to 60 Hz, with manual voltage selection. 30 W maximum. |
| Operating environment | 0 to 40 degrees C and up to 80% relative humidity |
| Standard package | Analyzer, USB A-to-B cable, IEC power cord, software and documentation on USB media, and quick start guide |
Calibration kits and related test equipment
- 6 GHz calibration kits. TBVC-NF6 (N female), TBVC-NM6 (N male), TBVC-SF6 (3.5 mm/SMA female), or TBVC-SM6 (3.5 mm/SMA male).
- Control-loop injection. TekBox lists TBJT01 and TBJT02 as optional wideband injection transformers. Choose the transformer based on the loop frequency range and injection setup.
- Common-mode isolation. See the TekBox TBCMC-1 RF common-mode choke for applications where cable common-mode current can affect the measurement.
Datasheet, manuals and software
- TBVNA-6000 datasheet
- TBVNA-6000 operating manual
- TBVNA-6000 getting started guide
- TekBox software, programming manual and application notes
- Programming manual
- Application note on antenna characterization
- Application note on control-loop stability
- Application note on advanced Bode measurements
- TekBox product page and current ordering information
OTHER PRODUCTS IN THE SAME CATEGORY:
EMSCOPE-RX2, 9kHz - 110MHz, 2 channel Receiver
EMSCOPE-RX4, 9kHz - 110MHz, 4 channel Receiver for 3 phase
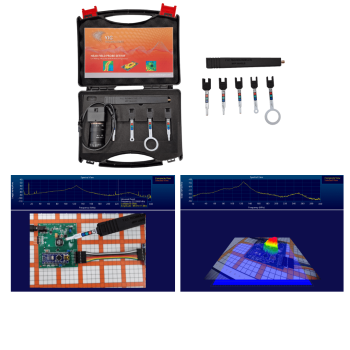
NFPKIT, EM Near Field Probe Kit w/Camera & Software
EMSCOPE Click Meter for CISPR 14-1
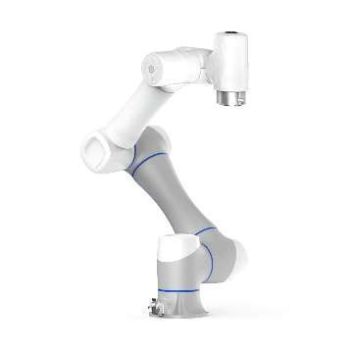
EMProbe CR5 - Custom Large-Reach Robotic EMI Scanning System
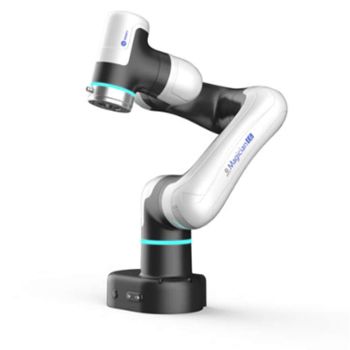
EMProbe-DBM-E6 — 6-Axis Robotic Near-Field EMI Diagnostics on the Bench
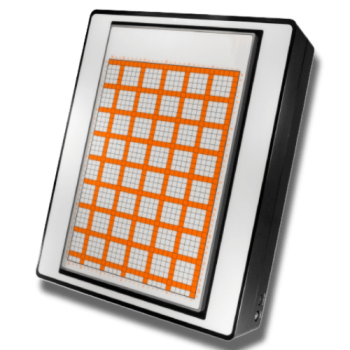
EMScanner+: 150 kHz- 6 GHz, w/ Real-Time Spectrum Analyzer, EMC desktop scanner
EMScannerR+: 150 kHz- 6 GHz, w/ Real-Time Spectrum Analyzer, EMC desktop scanner
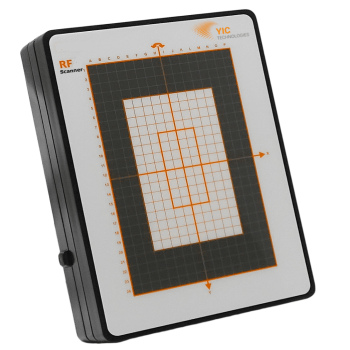
RFScanner, Antenna Pattern measurement, 300MHz - 6 GHz
EMProbe: 9kHz- 18 GHz, 0.2mm resolution, EMC robotic scanner
EMScannerR: 150 kHz- 8 GHz, 0.06mm resolution, EMC desktop scanner
EMScanner: 150 kHz- 8 GHz, 3.5mm Resolution, EMC desktop scanner
LSAOL 1.2 Laser-Powered Analog Optical Link
TBMR-110M DC - 110 MHz high speed EMI-Analyzer
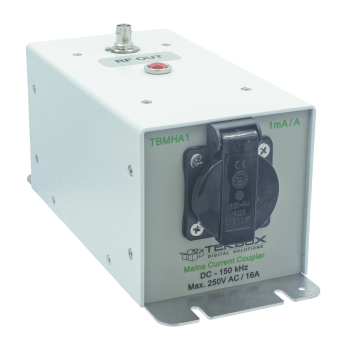
TBMHA1 Mains Harmonics Current Coupler
TBVNA-6000 0.1 Hz – 6 GHz Vector Network Analyzer
eNFPKIT, Educational Kit EM Near Field Probe Kit w/Camera & Software
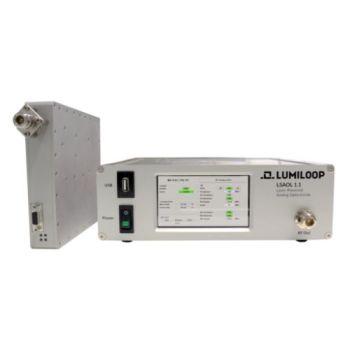
LSAOL 1.1, Laser Powered RF Link, 9kHz - 6GHz Discontinued
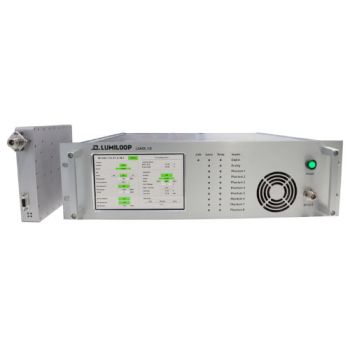
LSAOL 1.0, Laser Powered RF Link, Discontinued