LSProbe 1.2 Application Note, Measuring Pulsed Fields
LSProbe 1.2 Application Note, Measuring Pulsed Fields
LUMILOOP GmbH May 15, 2018
1 Introduction and Experimental Setup
The LSProbe 1.2 E-field probe offers superior sampling speed, accuracy, and dynamic range. The field probe’s design and calibration ensure a CW damage level in excess of 10 kV/m for all frequencies. This document examines the operation of the LSProbe 1.2 E-field probe in the presence of pulsed electric fields much larger than the specified damage level. The presented results prove the field probe’s hardiness and show how it may be used to characterize such fields.
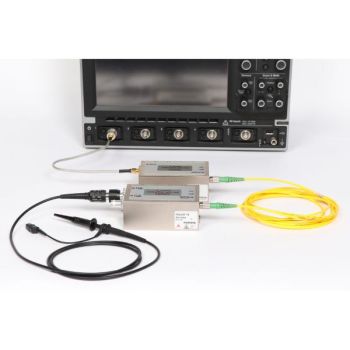
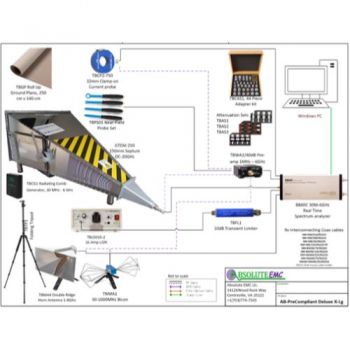
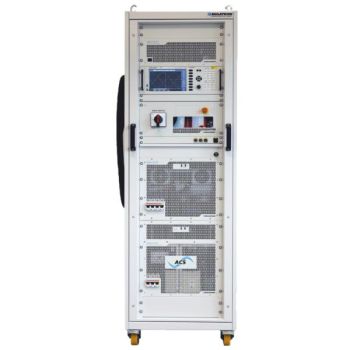
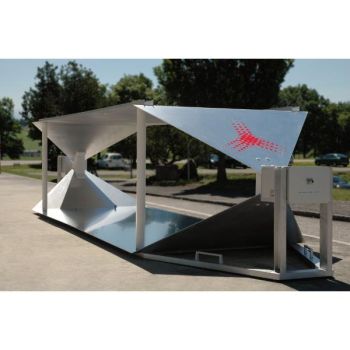
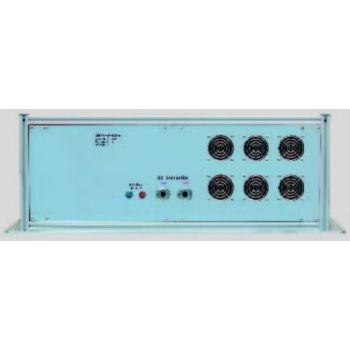
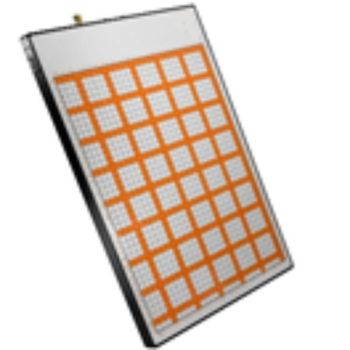
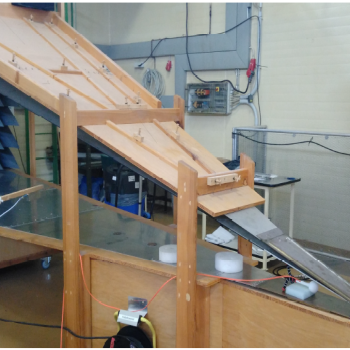
An LSProbe 1.2, serial number 10 as shown in Fig. 1 is placed centrally in a laterally open GTEM waveguide. The approximately 5 m long GTEM waveguide is fed by a Kentech Instruments Ltd. PBG7 pulse generator capable of driving 45 kV impulses into the 50 ? load. The generator achieves a rise time of 150 ps and a half-value time of 2 ns. Impulses are generated at a rate of 500 Hz.
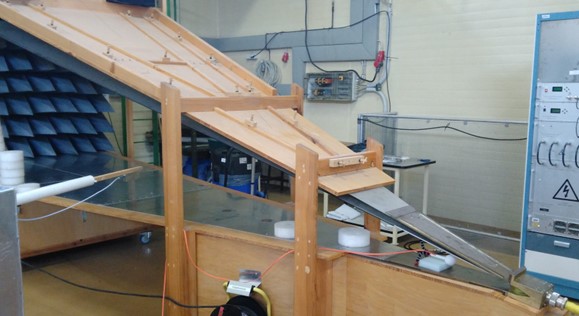
Figure 1: GTEM waveguide and pulse generator
The probe’s field strength is adjusted by changing the pulse generator’s output configuration and varying the field probe’s position inside the waveguide, as shown in Fig. 2. The field probe is operated in mode 0, which is suitable for frequencies ranging from 30 MHz to 6 GHz. The sampling rate in mode 0 is 500,000 Samples/s, and the analog rise time is approximately 330 ns.
Raw received signal strength (RSSI) values are recorded instead of E-field values in order to gain insight into possible over-drive conditions of the field probe. The RSSI values have a slope of approximately 170 LSB per dB.

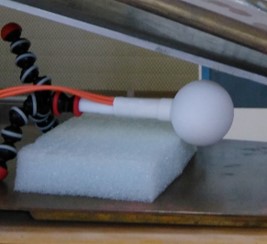
(a) Alignment, x E- (b) Alignment, y E-
Figure 2: E-field probe placement for low (a) and high (b) field strengths
2 Experimental Results
For 7, 14, 75, and 150 kV/m, measurements are performed as shown in Fig. 2a, i.e. the E-field is aligned in parallel with the field probe’s x-axis. For 300 and 600 kV/m, the y-axis is aligned in parallel with E-field, see Fig. 2b.
Fig. 3 shows typical impulses for each field strength value, the gaps between the impulses have been removed programmatically for the sake of clarity.
Fig. 4 shows a plot of RSSI value versus the logarithmic field strength. The plot clearly shows peak RSSI values that are in proportion to the generator’s pulsed field strength. The waveform for 150 kV/m is a slight exception to this trend. Due to the statistical nature of the measurements and the small number of measurements for this field strength, the real peak value was not recorded properly. In every case axes perpendicular to the E-field vector are separated from the preferential axis by approximately 20 dB.
In Fig. 3 there are RSSI values lower than the noise floor of the preferential axis. Such behavior is observed during calibration for very large signal levels. It can thus be concluded that the RSSI detector is experiencing an over-drive condition.

Figure 3: RSSI-values for various pulsed field strengths, sampled at 500 kSamples/s
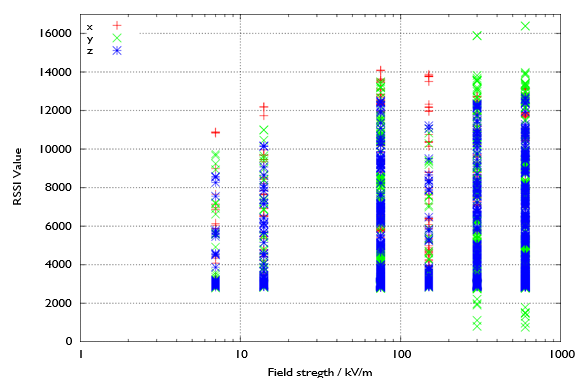
Figure 4: RSSI value vs. pulsed field strength
3 Conclusions
The LSProbe 1.2 E-field probe operates reliably for field strengths up to 600 kV/m. As expected, no damage has been observed during or after the measurements. It can thus be concluded that the E-field probe may be exposed to large pulsed electric fields as long as their mean value does not exceed the field probe’s damage level.
It can be observed that the field probe’s input and power detector act as a low-pass filter for the incoming pulses. Naturally, the field probe cannot detect the true peak E-field value since its analog rise time is much too low. However, it can be shown that the relative height of the field pulse is proportional to the apparent field strength value. For a pulse generator whose pulse shape is constant over time and which generates a continuous train of identical impulses, LSProbe 1.2 can be employed to measure the relative pulsed electrical field strength.
The measurements given in this application note have been performed with pre-production field probe hardware and software. The production version of the LSProbe 1.2 E-field probe comes with a number of features that greatly simplify the measurement of pulsed fields, such as:
Burst Mode In burst mode, sampling is performed at a rate of 2 MSamples per second. The temporal resolution can thus be improved by a factor of four relative to the results presented in this application note.
Field Triggering The peak value of a pulsed E-field can be determined easily by using a field-triggered operation and setting the trigger level as high as possible. Since the field probe sampling frequency and pulse repetition frequency are not synchronized, sampling near the peak value of the pulsed field will occur eventually, effectively yielding a peak-hold waveform.
Statistics Mode The Q4 2016 firmware and software update introduces the seamless collection of field strength statistics. Statistics mode includes the measurement of maximum field strength and determining the field strength distribution over unlimited periods of time. A pulsed field with a constant pulse shape produces a characteristic relative field strength distribution which can be calibrated for each pulse shape to obtain absolute field strength values.
LSProbe 1.2 is a highly capable platform for the measurement of various electric fields. New and improved features are constantly being added to its firmware and software without any need for hardware modifications or re-calibration. Please refer to the most recent LSProbe
1.2 User’s Manual for a complete list of available functions. Please contact LUMILOOP GmbH for application support and additional feature requests.
4 Acknowledgement
The results contained in this application note are presented with the permission of the Bundeswehr Research Institute for Protective Technologies and CBRN Protection (WIS) in Munster. We thank Mr. Kreitlow and his colleagues for their kind support in the course of the experiments.